PrecisionLife brings new insight into chronic disease biology through its unique patented combinatorial analytics platform.
Building combinatorial risk scores to predict personal disease risk
Combinatorial Risk Scores - more accurate and more personalized
Chronic diseases are complex and often present as a spectrum of related symptoms rather than a single clean diagnosis. Both the causative factors of chronic diseases, and the symptoms, severities, and treatment responses of patients vary extensively. This is because they are governed by combinations of multiple genetic variants and other external epidemiological and environmental factors, which affect the function of genes and that interact in non-linear fashion via feedback loops in complex metabolic and genetic networks.
Polygenic risk scores (PRS) have struggled to provide accurate predictions for these more complex diseases, which is why we have built a new class of prediction tool called a Combinatorial Risk Score (CRS), which is more accurate and provides more personalized predictions.

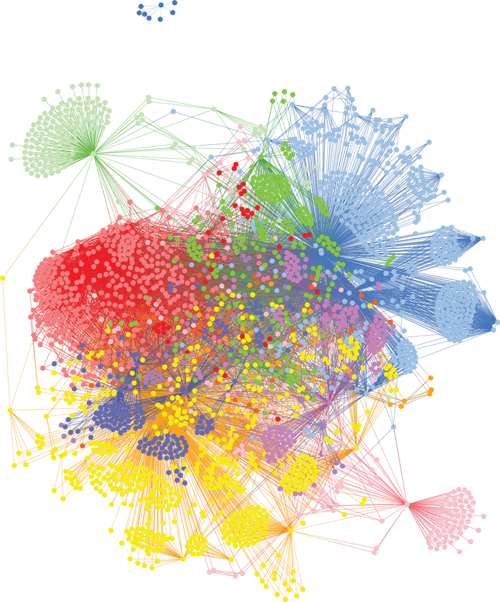
All too often for chronic disease, its diagnostic code hides a picture of interrelated complexity, with multiple patient subgroups having subtly different forms of the disease with different causes and different treatment responses. In many of the major chronic diseases such as cardiovascular, respiratory, autoimmune, metabolic, neuropsychiatric and neurodegenerative disorders, there are actually multiple different patient subgroups as can be seen in the coloured clusters of patient communities in the Alzheimer’s patient stratification graph (Figure 1).
This breaks the assumptions underpinning many genetic prediction tools including polygenic risk scores (PRS) – namely that the contributions of lots of single SNPs (identified by GWAS as being disease associated) are independent and additive. In PRS the SNP contributions can be weighted in clever ways to reflect SNP frequency or effect size, but basically to understand their combined effect you simply add them together.
We’ve noted before that this traditional approach misses some crucial signal – it’s like trying to predict the winning hand at poker by adding together the face value of cards in each hand. If you predicted winning hands that way, you would miss many cases where lower value cards (or common SNPs in the genetic case) come together in combination to exert a larger effect than would be predicted by your model.
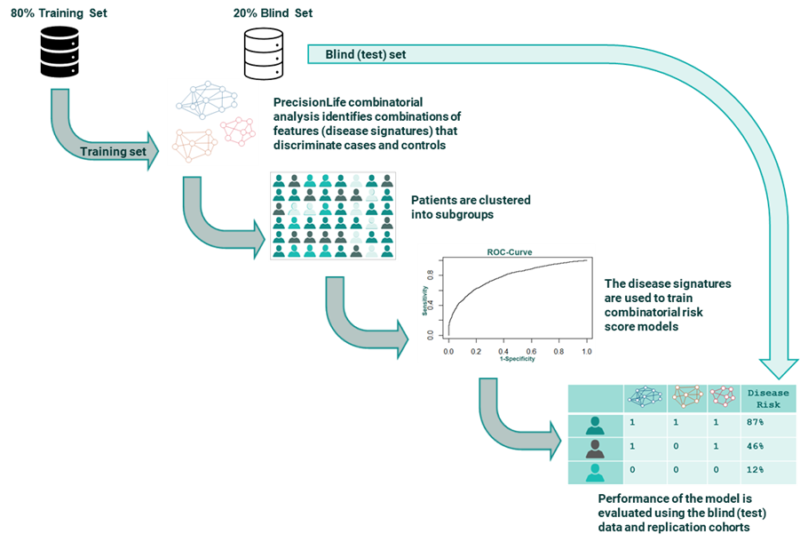
PrecisionLife on the other hand detects combinations of SNPs (and other factors) that in combination are associated with a disease phenotype, usually with very high significance. We call these combinations disease signatures, and they can be associated with disease risk, protective effect, therapy response or other phenotype.
Using a combinatorial approach we can, for the first time, directly capture the non-linear signal describing the specific effect of interactions between those SNPs and other factors as it plays out and is observed in the patient population.
Building Combinatorial Risk Scores
Now when we build a Combinatorial Risk Scores (CRS), we use these combinatorial disease signatures as our building blocks instead of single SNP contributions. Each combinatorial disease signature carries far more accurate predictive signal as their p-values are lower than single SNPs, and their effects are not averaged across the whole patient population. Instead the specific effects of that combination on the patient subgroup to which it is relevant can be directly evaluated.

The resulting CRS model is much more accurate and offers the potential for much more personalized CRS scores (as opposed to the population average view offered by PRS).
A good example of this power is the prediction (at the point of diagnosis) of patients who will progress to severe disease and specific complications in type-II diabetes. A CRS model using a mix of 20 genotype and phenotype features predicts type-II diabetes risk on a blind dataset from a UK Biobank population with AUCs of 0.80 and 0.83 for males and females. This is a significant improvement on current PRS models built on the same dataset.
The CRS model can further stratify the type 2 diabetes population into 5 distinct clusters based only on their genotypes, and associate these with differentiated risk of developing specific type-II diabetes related complications (renal failure, cardiovascular, neuropathy etc). This is of massive potential benefit to healthcare systems and patients as we will discuss in a later blog.
CRS are rooted in unique disease insights derived from combinatorial analysis and high-resolution patient stratification. Especially for complex, chronic disease, they offer a significant improvement in sensitivity and selectivity over the blurred and averaged predictions a PRS can make.
Contact us
Ask us a question or contact us to discuss potential collaborations and partnership opportunities by sending us a message here and we'll get back to you as soon as we can.
Form header
Sign Up
